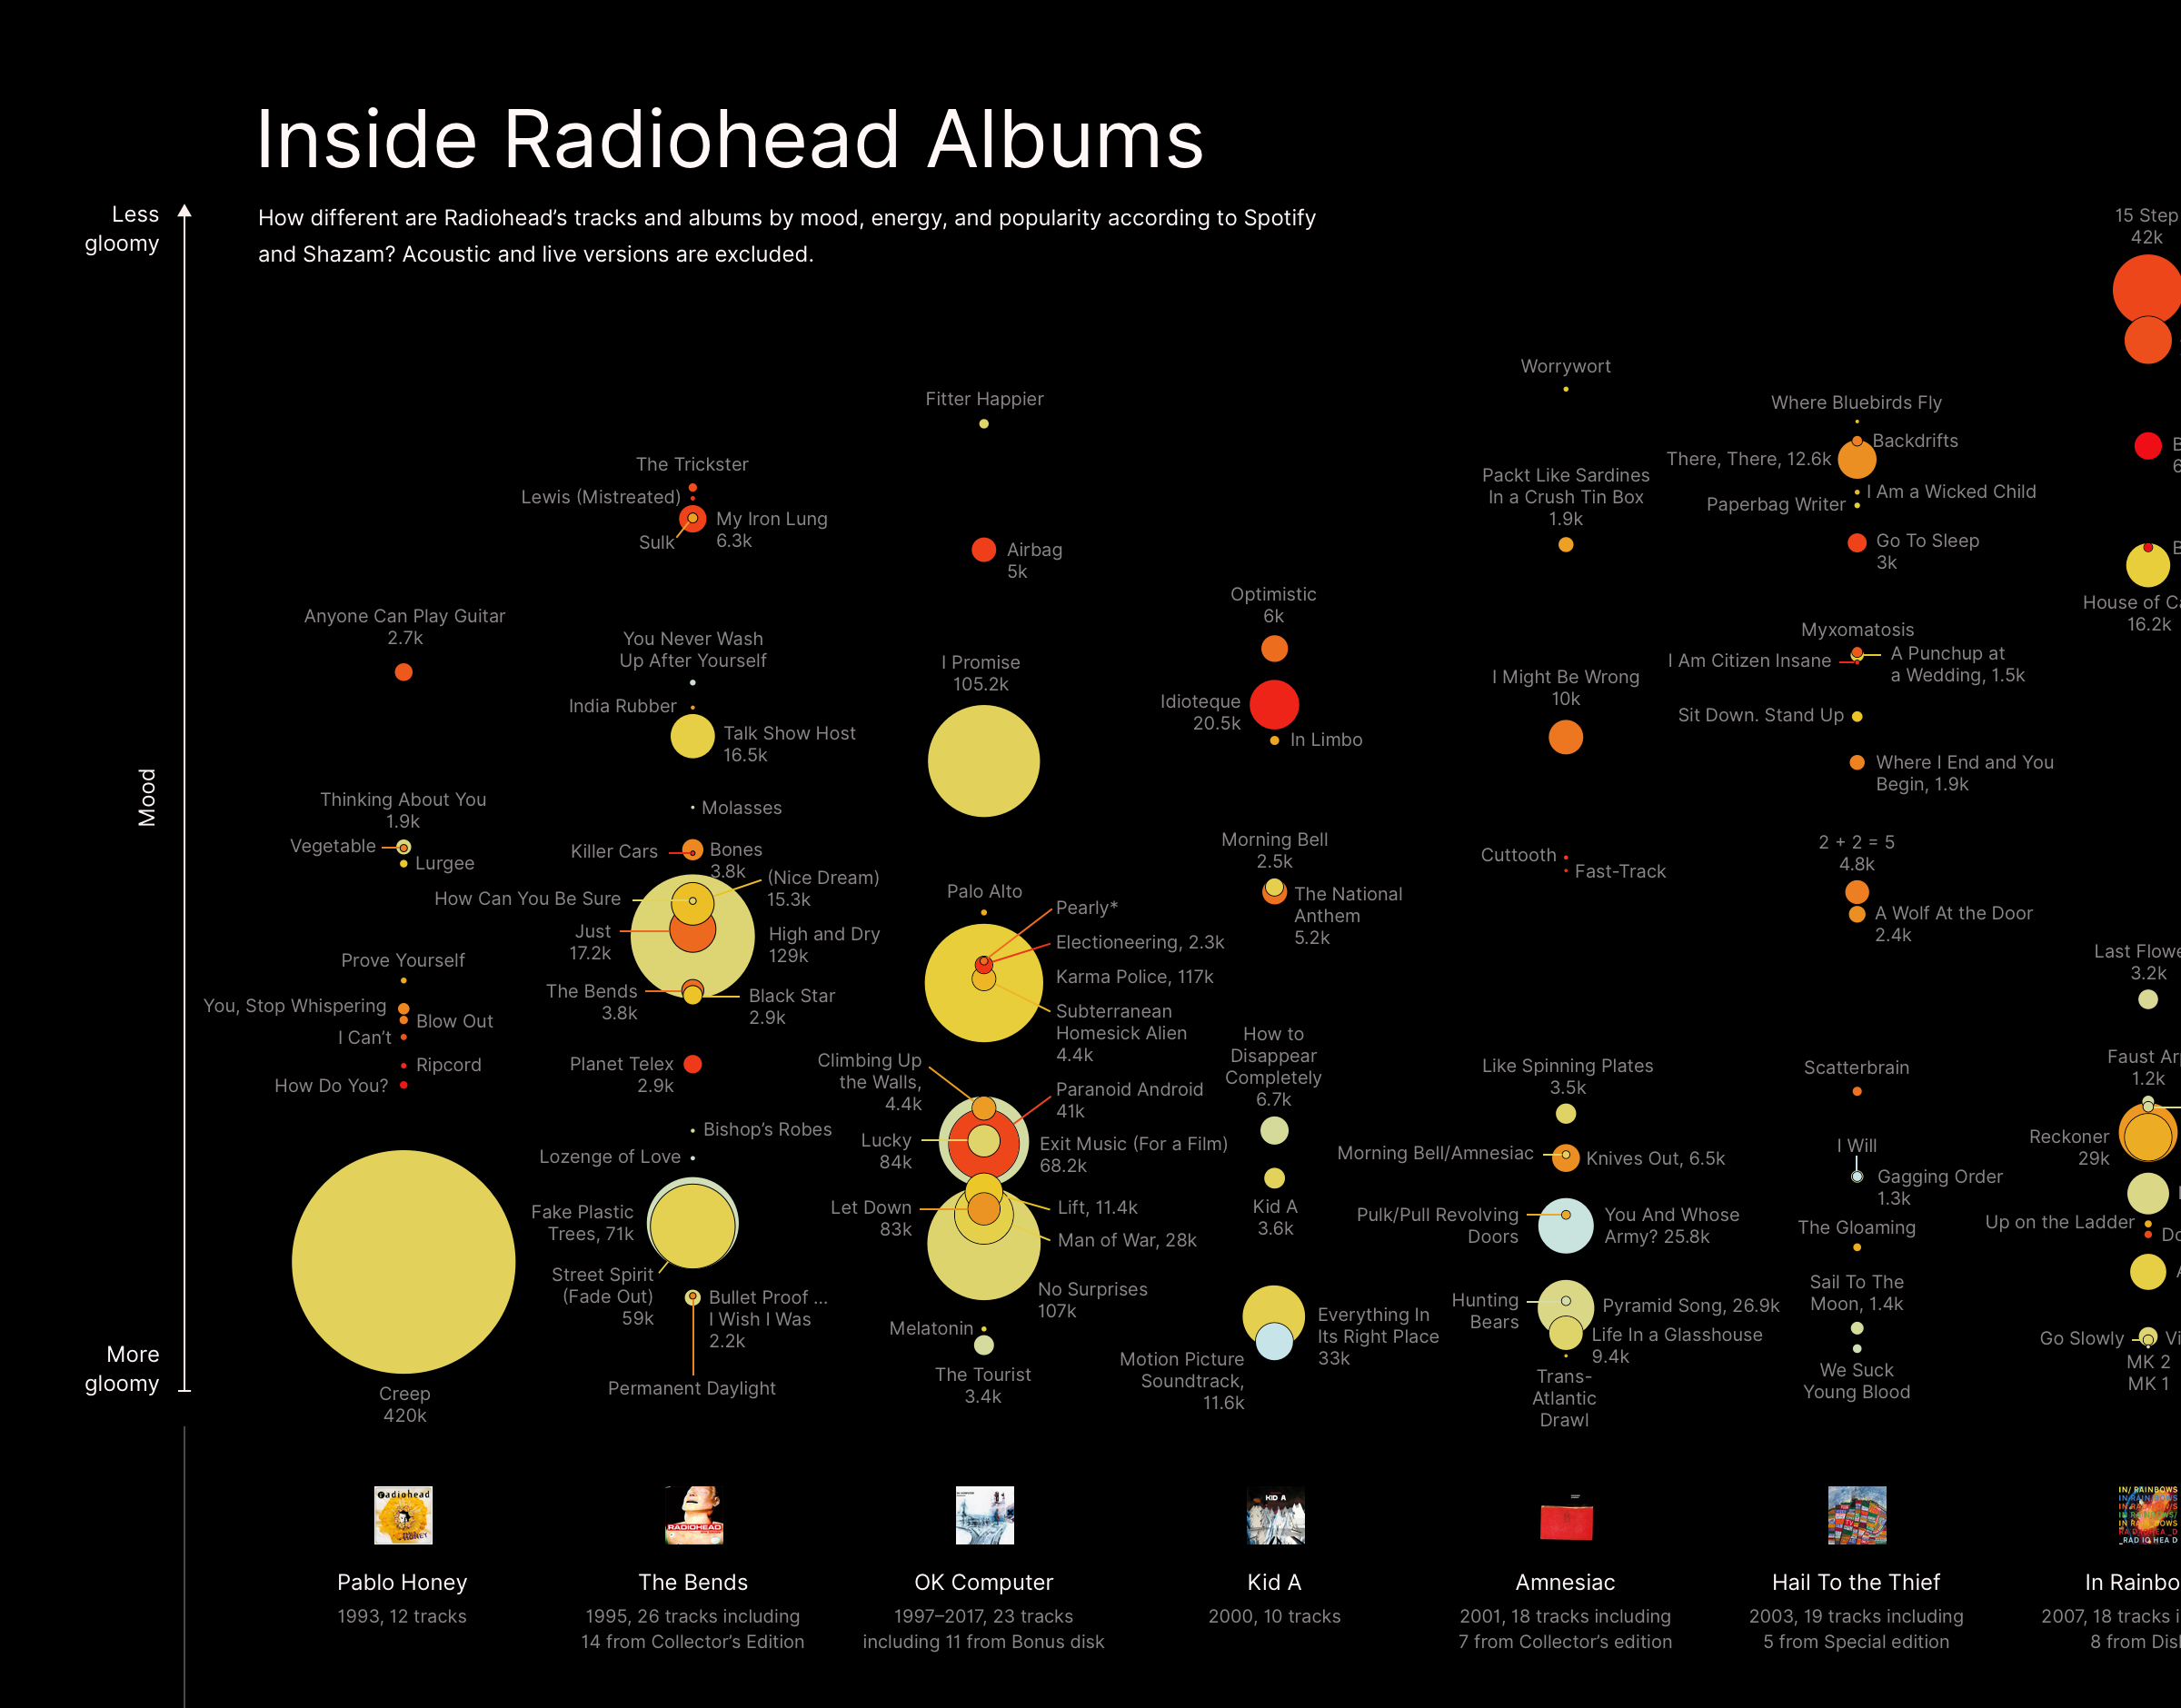
Inside Radiohead Albums
2019
After reading the beautiful book "The Functional Art" by Alberto Cairo, I was inspired to visualize something for fun. Radiohead music has always been close to my heart, so it seemed a nice idea to compare tracks and albums by some criteria.
- Get PDF version for print
- Data at Tableau
Collecting data
One day I found an awesome dataset by RCharlie and learned about the Spotify API that allows user to retrieve audio features by a bunch of characteristics, for instance, how loud, fast, danceable or acoustic a song is. One of the features is "valence", which varies from 0 to 1 and represents a track's mood: the closer to 0, the more depressive the overall mood of the song is. Personally, I have never thought that all Radiohead songs are depressive; for example, I find "High and Dry", "Reckoner", "Lotus Flower" and a couple of others really uplifting by sound. It was interesting to check out what Spotify thinks of them.
Another feature is "energy" which represents how fast, loud and noisy a song is. Usually gloomy songs are slow, quiet and not so noisy, so I wanted to find out which Radiohead songs are of high "energy" but are actually rated as "sad".
It occured me to me that it would also be nice to find out what songs are the most likeable and popular. So I picked counts of shazams per year as a measure of a track's "likeability" and "catchiness". The idea is simple: when you use the Shazam application to recognize some song, in most cases it means you like it.
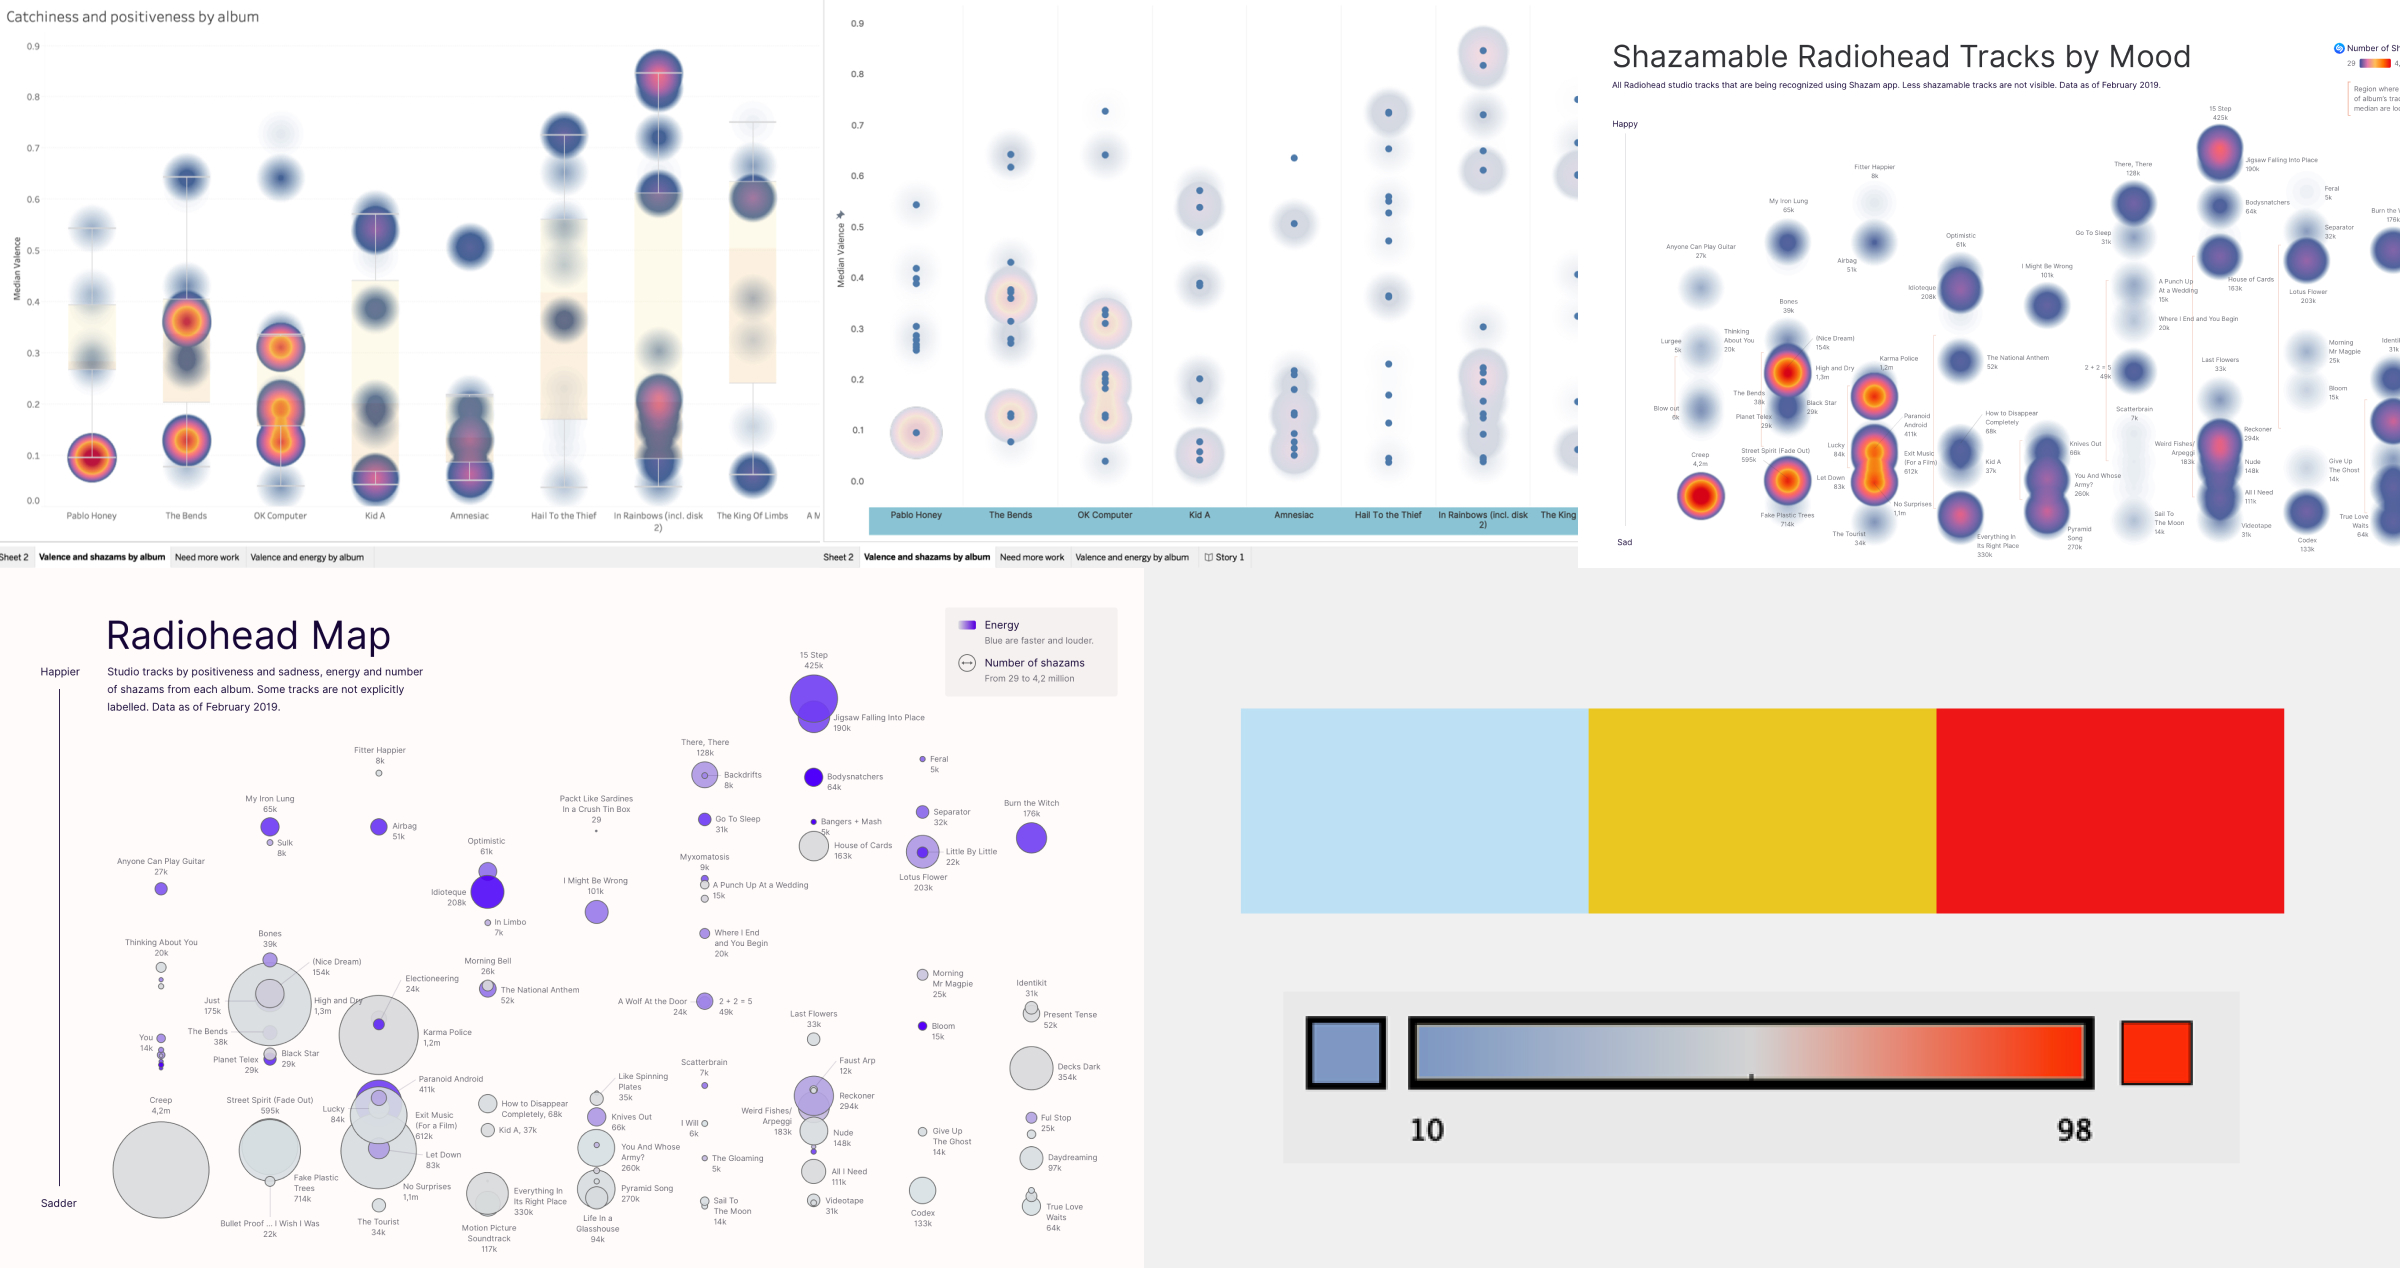
A few iterations in Tableau and Sketch:
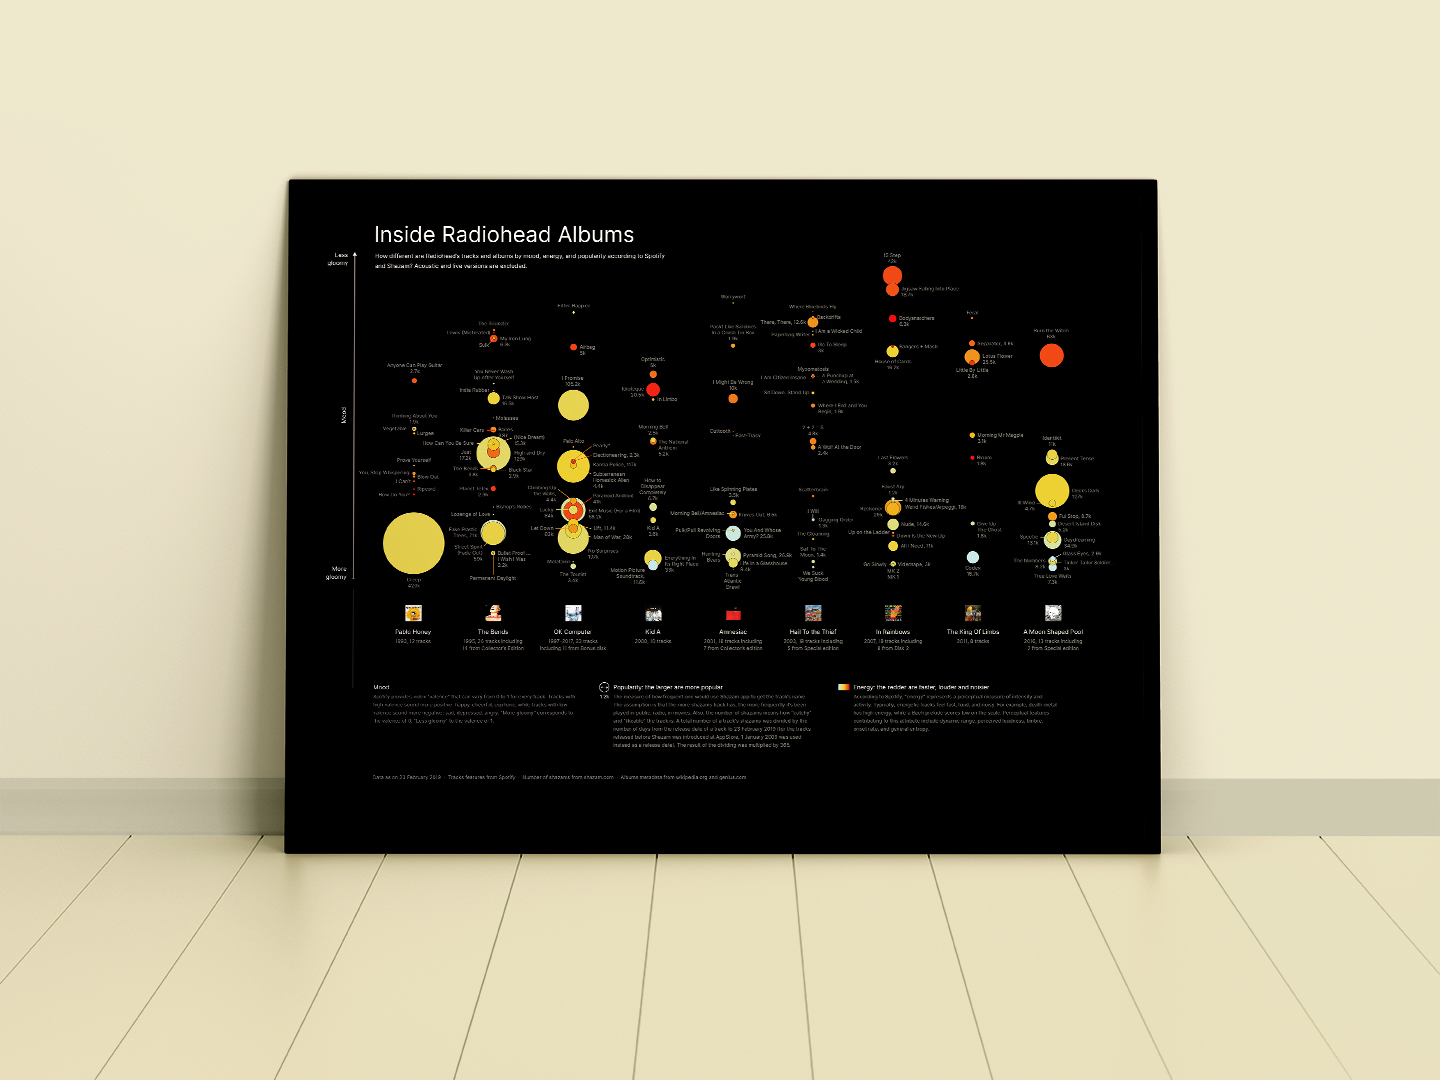
The final result looks like this:
Thoughts after
Obviously "OK Computer" and "The Bends" has the most number of "likeable" songs, but it's interesting that tracks from the latest album "A Moon Shaped Pool", e.g. "Decks Dark", has almost beaten "High and Dry", "Karma Police" and "No Surprises" by the number of shazams per year.
The last six albums commonly have fewer "middle ground" songs by mood: most songs are either depressive or towards the oppositeend of the scale. According to EchoNest who originally designed the "valence" feature, the most popular songs from 1950 to 2010 were in the middle between "happy" and "sad".
Emotions translated by music, especially as sophisticated as Radiohead's, are too complex and subject to individual perception to be ever precisely classified by a machine. The tracks "Fitter Happier" and "Burn the Witch" can hardly be considered as "happy" ones by meaning and message. However, having such data is a good starting point and it was interesting to play with the it.